Introduction
While working on my previous blog
post, I had tried
to use likwid-perfctr instead
of perf-stat. likwid-perfctr -e
segfaulted on my machine. This article goes into how I triaged this issue and reported it
to the LIKWID devs. It was “fun” in the way that having to open your CPU’s processor
programming reference manual is fun.
The Crash
Just like perf stat, likwid-perfctr prints all the PMU events available on
your platform using the flag -e. My CPU is a Ryzen 7 255, a (somewhat odd) Zen
4 uarch. likwid-perfctr -e appeared to run fine on the first invocation after
a cold reboot, but segfaulted on subsequent invocations.
I opened an issue on the project’s GitHub, and the issue template very helpfully
pointed me towards the -V3 command line option that prints very verbose debug
information. Here’s the relevant snippet from the first invocation that does not segfault.
...
DEBUG - [perfmon_check_counter_map:819] Counter DFC0 at pos 15 with dev (MSR_DEV) (0) 0
DEBUG - [perfmon_check_counter_map:819] Counter DFC1 at pos 16 with dev (MSR_DEV) (0) 0
DEBUG - [perfmon_check_counter_map:819] Counter DFC2 at pos 17 with dev (MSR_DEV) (0) 0
DEBUG - [perfmon_check_counter_map:819] Counter DFC3 at pos 18 with dev (MSR_DEV) (0) 0
DEBUG - [perfmon_check_counter_map:819] Counter DFC4 at pos 19 with dev (MSR_DEV) (0) 0
DEBUG - [access_client_read:517] Got error 'failed to read/write register' from access daemon reading reg 0xC0010248 at CPU 0
DEBUG - [perfmon_check_counter_map:819] Counter DFC5 at pos 20 with dev (MSR_DEV) (0) 0
DEBUG - [access_client_read:517] Got error 'failed to read/write register' from access daemon reading reg 0xC001024A at CPU 0
DEBUG - [perfmon_check_counter_map:819] Counter DFC6 at pos 21 with dev (MSR_DEV) (0) 0
DEBUG - [access_client_read:517] Got error 'failed to read/write register' from access daemon reading reg 0xC001024C at CPU 0
DEBUG - [perfmon_check_counter_map:819] Counter DFC7 at pos 22 with dev (MSR_DEV) (0) 0
DEBUG - [access_client_read:517] Got error 'failed to read/write register' from access daemon reading reg 0xC001024E at CPU 0
DEBUG - [perfmon_check_counter_map:819] Counter DFC8 at pos 23 with dev (MSR_DEV) (0) 0
DEBUG - [access_client_read:517] Got error 'failed to read/write register' from access daemon reading reg 0xC0010250 at CPU 0
DEBUG - [perfmon_check_counter_map:819] Counter DFC9 at pos 24 with dev (MSR_DEV) (0) 0
DEBUG - [access_client_read:517] Got error 'failed to read/write register' from access daemon reading reg 0xC0010252 at CPU 0
DEBUG - [perfmon_check_counter_map:819] Counter DFC10 at pos 25 with dev (MSR_DEV) (0) 0
DEBUG - [access_client_read:517] Got error 'failed to read/write register' from access daemon reading reg 0xC0010254 at CPU 0
DEBUG - [perfmon_check_counter_map:819] Counter DFC11 at pos 26 with dev (MSR_DEV) (0) 0
DEBUG - [access_client_read:517] Got error 'failed to read/write register' from access daemon reading reg 0xC0010256 at CPU 0
DEBUG - [perfmon_check_counter_map:819] Counter DFC12 at pos 27 with dev (MSR_DEV) (0) 0
DEBUG - [access_client_read:517] Got error 'failed to read/write register' from access daemon reading reg 0xC0010258 at CPU 0
DEBUG - [perfmon_check_counter_map:819] Counter DFC13 at pos 28 with dev (MSR_DEV) (0) 0
DEBUG - [access_client_read:517] Got error 'failed to read/write register' from access daemon reading reg 0xC001025A at CPU 0
DEBUG - [perfmon_check_counter_map:819] Counter DFC14 at pos 29 with dev (MSR_DEV) (0) 0
DEBUG - [access_client_read:517] Got error 'failed to read/write register' from access daemon reading reg 0xC001025C at CPU 0
DEBUG - [perfmon_check_counter_map:819] Counter DFC15 at pos 30 with dev (MSR_DEV) (0) 0
DEBUG - [access_client_read:517] Got error 'failed to read/write register' from access daemon reading reg 0xC001025E at CPU 0
...
DFC is short for data fabric counter. It looks like likwid-perfctr -e builds some data structure
on the first invocation by querying various counters. It successfully checks 4 DFCs, but fails
to check 12 other DFCs.
Hmmm…
RTFM
The maintainer responding to my issue said that he will have to look at the AMD docs to verify the DFC counter information for Zen 4. I decided to go looking on my own. The first step of course is to determine which manual my CPU corresponds to. The kind of documentation we are looking for is called a Processor Programming Reference (PPR) in AMD docs. Unfortunately there is no document titled “Ryzen 7 255 Processor Programming Reference”. Instead, they are named something like “Processor Programming Reference (PPR) for AMD Family 1Ah Model 70h”. What is this family and model?
Let’s look at the info provided by lscpu (or cat /proc/cpuinfo):
Architecture:                x86_64
  CPU op-mode(s):            32-bit, 64-bit
  Address sizes:             48 bits physical, 48 bits virtual
  Byte Order:                Little Endian
CPU(s):                      16
  On-line CPU(s) list:       0-15
Vendor ID:                   AuthenticAMD
  Model name:                AMD Ryzen 7 255 w/ Radeon 780M Graphics
    CPU family:              25
    Model:                   117
    Thread(s) per core:      2
    Core(s) per socket:      8
    Socket(s):               1
    Stepping:                2
    Microcode version:       0xa705208
...
There we have it: model 117, family 25. Converting that to hexadecimal, we get
julia> UInt8(117)
0x75

julia> UInt8(25)
0x19
The “h” suffix in the PPR name means hexadecimal. So, we are looking for a document that looks like “Processor Programming Reference (PPR) for AMD Family 19h Model 75h”. Looking it up on docs.amd.com, I found the document “Processor Programming Reference (PPR) for AMD Family 19h Model 70h”, which actually covers models 70h-77h. Per this manual, there should be 16 independent counters for DF events that can be configured simultaneously.
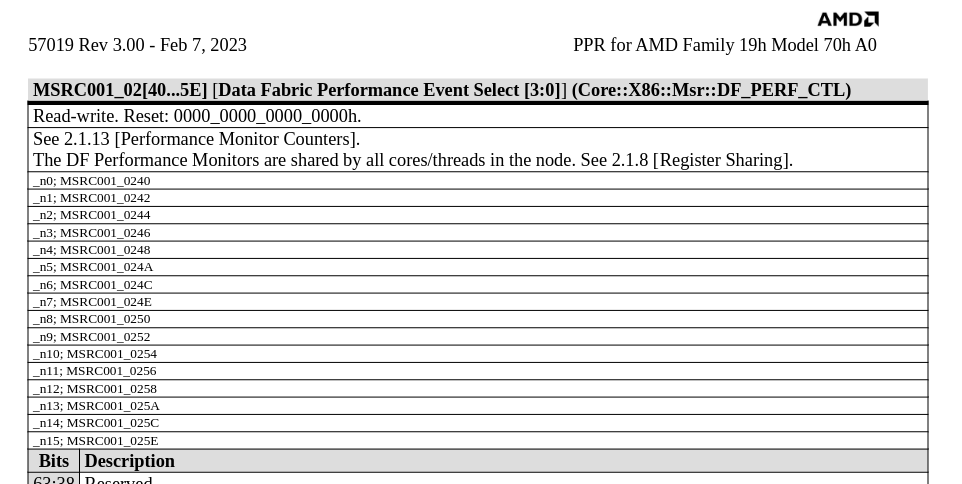
Note that all 16 of these are shared across all cores.
Checking using cpuid and inline asm
The manual very helpfully shows how to verify the DFC count.
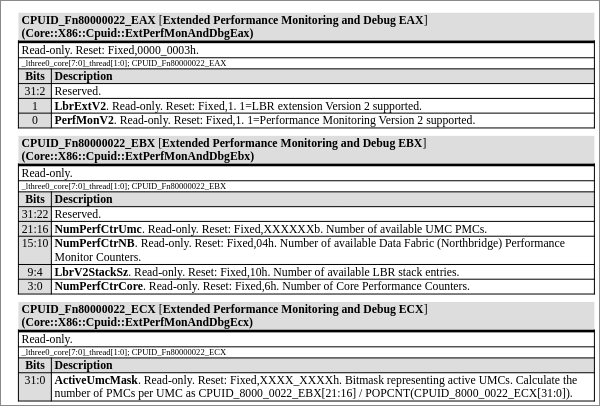
Figure 2 shows a few cpuid leaf functions. In x86, cpuid is an instruction that returns processor identification and feature information to the eax, ebx, ecx, and edx registers. The returned values are determined by the values in eax, and sometimes ecx as well.
The second table (CPUID_Fn80000022_EBX) shows that bits [15:10] of the ebx
register should contain the number of available data fabric counters when the
cpuid instruction is invoked with 0x80000022 is passed in the eax register
(from the function name). It also very helpfully states that this value is fixed
at 0x4. Which explains the output of likwid-perfctr -e and the subsequent
segfault. The eax and ecx registers for the same function report support for LBR
V2 and Performance Monitoring V2 support, and active UMC information
respectively.
We can use this information to figure things out for ourselves using a simple program.
#include <stdio.h>
#include <stdint.h>

int main(void) {
    uint32_t eax, ebx, ecx, edx;

    __asm__ volatile (
        "cpuid"
        : "=a"(eax), "=b"(ebx), "=c"(ecx), "=d"(edx)
        : "a"(0x80000022), "c"(0)
    );

    printf("CPUID leaf 0x80000022 (AMD Performance Monitoring and Debug)\n");
    printf("  EAX = 0x%08X\n", eax);
    printf("  EBX = 0x%08X\n", ebx);
    printf("  ECX = 0x%08X\n", ecx);
    printf("  EDX = 0x%08X\n", edx);
    printf("\n");

    /* EAX bits */
    printf("EAX breakdown:\n");
    printf("  PerfMonV2 supported : %s\n", (eax & (1 << 0)) ? "yes" : "no");

    /* EBX bits */
    uint32_t num_core_ctrs = ebx & 0xF;           /* bits 3:0  */
    uint32_t num_df_ctrs   = (ebx >> 10) & 0x3F;  /* bits 15:10 */
    uint32_t num_umc_ctrs  = (ebx >> 16) & 0x3F;  /* bits 21:16 */

    printf("EBX breakdown:\n");
    printf("  Core PMC count      : %u\n", num_core_ctrs);
    printf("  DF (NB) PMC count   : %u\n", num_df_ctrs);
    printf("  UMC PMC count       : %u\n", num_umc_ctrs);

    /* ECX bits */
    printf("ECX breakdown:\n");
    printf("  Active UMC mask     : 0x%08X\n", ecx);
    if (ecx != 0) {
        /* popcount to get number of active UMCs */
        uint32_t active = ecx;
        int n = 0;
        while (active) { n += active & 1; active >>= 1; }
        printf("  Active UMC count    : %d\n", n);
        if (num_umc_ctrs > 0 && n > 0)
            printf("  PMCs per UMC        : %u\n", num_umc_ctrs / n);
    }

    return 0;
}
This is the stdout (emphasis mine):
CPUID leaf 0x80000022 (AMD Performance Monitoring and Debug)
  EAX = 0x00000003
  EBX = 0x00101106
  ECX = 0x0000000F
  EDX = 0x00000000

EAX breakdown:
  PerfMonV2 supported : yes
EBX breakdown:
  Core PMC count      : 6
  DF (NB) PMC count   : 4    <=============================== 4 DFCs!
  UMC PMC count       : 16
ECX breakdown:
  Active UMC mask     : 0x0000000F
  Active UMC count    : 4
  PMCs per UMC        : 4
This reports that there are 4 DF PMCs, which matches with the debug output of likwid-perfctr -e.
Hmmmmmmmmm…
Conclusion and Follow Up
I reported all this information to the maintainer, and they have fixed this for Zen4/4c/5 by changing the DFC count to be determined dynamically using CPUID like they were already doing for UMCs; it now correctly reports 4 DFCs on my machine.
However, there is still a lot that I do not understand. My goal was just to get
likwid-perfctr working, but how exactly do I reconcile the apparent
discrepancy between Figure 1 and Figure 2? I’ll have to dig into section 2.1.8 on register sharing,
and also better understand non general-purpose registers (GPRs) like
model-specific registers (MSRs), and how to directly interact with them at the
lowest level.