Introduction
I have a Zen 4 CPU with a bunch of AVX512 feature flags. So I thought - let’s try and use it to implement something, even if it’s in the realm of wheel-reinvention. I started with the following goals.
- Implement an algorithm that cannot be vectorized by my optimizing compiler, even with a polyhedral loop model.
- Systematically analyze its performance and answer the questions
- Is it as fast as it can be?
- If not, why? And how can we fix it?
- Start simple, make it work.
Which means that dead simple algorithms like map/transform, reduce,
adjacent_difference etc are out, as they are very autovectorizable. Even 2D stencils are out because look at this. So, I
settled on std::copy_if.
Implementing a SIMD implementation is the easy part. Figuring its performance out ended up being less trivial than I anticipated. I already knew the tools that I will need.
- Google benchmark for writing microbenchmarks
- likwid-bench for determining performance upper bound on my machine
- llvm-mca for simulating the kernel on its model of Zen 4
- perf-stat for drill-down performance analysis by counting events
From cppreference,
std::copy_if is a dead-simple algorithm.
template<class InputIt, class OutputIt, class UnaryPred>
OutputIt copy_if(InputIt first, InputIt last,
                 OutputIt d_first, UnaryPred pred)
{
    for (; first != last; ++first)
        if (pred(*first))
        {
            *d_first = *first;
            ++d_first;
        }

    return d_first;
}
The codegen is also very clean (compiler explorer link). It
is however non-trivial to vectorize because of a loop-carried dependency: the
value of d_first in iteration i+1 depends on the value of pred(*first) in
iteration i. Let us measure our baseline before we go about vectorizing.
These are the dimensions along with we can measure performance.
- Input size (henceforth
n) - Choice of predicate function
- Input distribution
- Input entropy
The problem size (1) is trivial to sweep over; varying n results in different interactions
with the memory subsystem (caches, hardware prefetchers, DRAM etc).
The predicate and distribution together determine the density/sparsity of the
output. E.g. the predicate [](auto x){ return x > 0; } along with a uniformly
distributed input in the range (-1000,1000) results in an expected 50% of the
input values being copied over.
The entropy is not orthogonal to the distribution, but it’s worth mentioning separately. Perhaps I need to think of a better name too. This determines how predictable the input is, because all pipelined CPUs have branch-prediction logic. E.g. if the CPU frontend (FE) finds a conditional jump instruction, it will not wait for its operand to be ready and will instead speculatively jump to a target address. Misspeculation results in a large penalty requiring a complete pipeline flush and restarting execution. The same predicate and distribution combination as above can make it difficult for most branch predictors to have a high branch-miss-rate, thereby adversely affecting throughput.
In the interest of brevity, we fix the predicate (x > 0) and distribution
(uniform in (-1000,1000)), and sweep over the problem size. The performance
analysis methods that we shall use here generalize well for tuning the
implementation for inputs along other dimensions.
We use likwid-bench
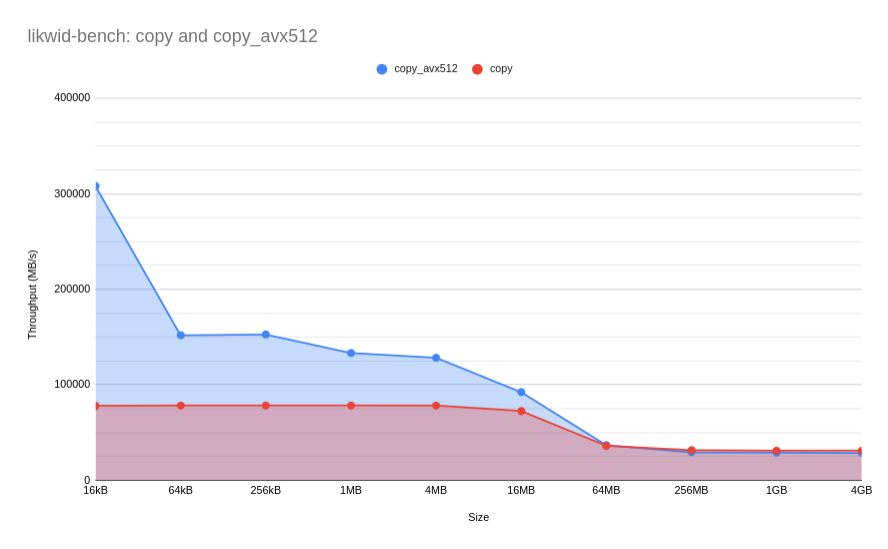
copy and copy_avx512 benchmarks in likwid-benchReproduce using the following commands:
$ for size in 16kB 64kB 256kB 1MB 4MB 16MB 64MB 256MB 1GB 4GB; do
	bw=$(likwid-pin -c 1 likwid-bench -t copy_avx512 -w S0:${size}:1 2>/dev/null |
	grep "MByte/s" |
	awk '{print $NF}'); \
	echo "$size $bw";
  done


$ for size in 16kB 64kB 256kB 1MB 4MB 16MB 64MB 256MB 1GB 4GB; do
	bw=$(likwid-pin -c 1 likwid-bench -t copy -w S0:${size}:1 2>/dev/null |
	grep "MByte/s" |
	awk '{print $NF}');
	echo "$size $bw";
  done
First SIMD Attempt
There are three parts to the loop body.
- Load from
&input[i] - Evaluate predicate to get a
boolvalue - Conditionally store the loaded value to destination based on the previous result and update output counter/pointer.
1 and 2 are straightforward in most SIMD implementations. Let N be the width
of the SIMD registers. E.g. in
AVX-512 for loading 32-bit values, N = 512/32 = 16.
- Load into a SIMD register from
&input[i]_mm512_loadu_epi32and friends.
- Evalute predicate on SIMD register to get a SIMD mask value.
- For our predicate (
>(0)),const auto zero = _mm512_setzero_epi32(); return _mm512_cmpgt_epi32_mask(a, zero);
- For our predicate (
- Contiguously store the SIMD lanes for whom the corresponding mask bit is 1.
- Turns out that there is an instruction that does just that:
_mm512_mask_compressstoreu_epi321. - And the destination pointer can be updated by getting a popcount on the mask value that we got from step 2.
- Turns out that there is an instruction that does just that:
Of course, we also need another loop to handle the remaining elements that are less than the size of the SIMD width. Putting everything together, and unrolling once for the fun of it, we get this.
namespace ck {

template <typename Arg>
struct positive {
  bool operator()(const Arg& arg) const& {
    return arg > 0;
  }

  bool operator()(const Arg&& arg) const& {
    return arg > 0;
  }
};

template <>
struct positive<__m512i> {
  __mmask16 operator()(const __m512i& a) const& {
    const auto zero = _mm512_setzero_epi32();
    return _mm512_cmpgt_epi32_mask(a, zero);
  }

  __mmask16 operator()(const __m512i&& a) const& {
    const auto zero = _mm512_setzero_epi32();
    return _mm512_cmpgt_epi32_mask(a, zero);
  }
};

template <template <typename> class Predicate>
int *copy_if(int const *input, int *output, size_t n, const Predicate<int> &p) {
  const auto vp = Predicate<__m512i>();
  constexpr auto vlen = 16;  // (512 / 8) / sizeof(int);
  constexpr auto unroll = 2;
  constexpr auto stride = vlen * unroll;
  auto sn = n - (n % stride);
  int *out = output;
  for (size_t i = 0; i < sn; i += stride) {
    // 1. load from memory into zmm register
    const auto v_in1 = _mm512_loadu_epi32(input + i);
    const auto v_in2 = _mm512_loadu_epi32(input + i + vlen);
	// 2. evaluate predicate to get predicate mask
    const __mmask16 m1 = vp(v_in1);
    const __mmask16 m2 = vp(v_in2);
	// 3.1 Contiguously store values from zmm register where mask bit is 1
    // dependencies galore!
    _mm512_mask_compressstoreu_epi32(out, m1, v_in1);
    const auto d1 = _mm_popcnt_u32(m1);
    _mm512_mask_compressstoreu_epi32(out + d1, m2, v_in2);
    const auto d2 = d1 + _mm_popcnt_u32(m2);
	// 3.2 update output pointer
    out += d2;
  }
  // handle remainder
  for (auto i = sn; i < n; i++) {
    if (p(input[i])) {
  	  *out = input[i];
	  out++;
    }
  }
  return out;
}
} // namespace ck
Check it out on compiler explorer.
A few observations:
- The loop body is now branchless - I expected this to have virtually no bad speculation
- I need to move the mask to a general purpose register (GPR) in order to get its popcount.
First Moment of (Bitter) Truth
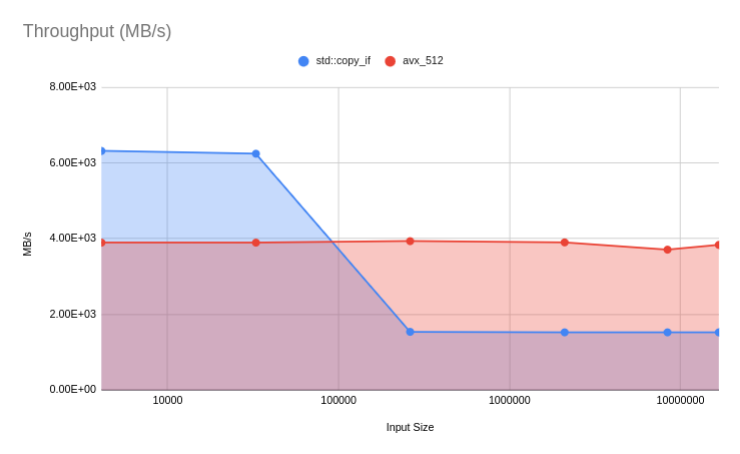
std::copy_if and the AVX-512 implementation.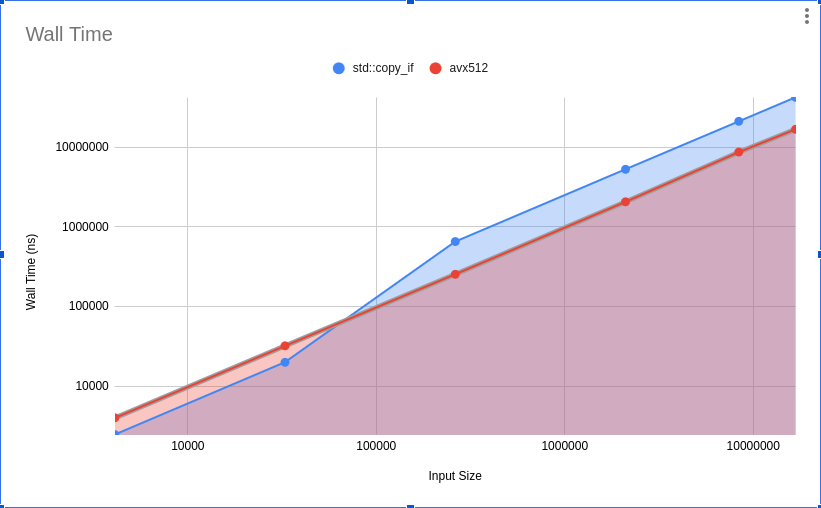
std::copy_if and the AVX-512 implementation.We hebben een serieus probleem; the achieved throughput ~4 GB per second for all input sizes, which means:
- It’s slow as shit since the memory subsystem is capable of sustaining ~26.5 GB/s for a 4GB working set, and ~300GB/s for a 4KB working set, as shown in by the throughput upper bound for copying data.
- It’s invariant with respect to problem size, and most likely not experiencing memory hierarchy effects.
At this point my first guess was that one of the AVX-512 instructions has a much longer latency or much lower throughput than I expected. We have three AVX-512 instructions.
- SIMD load
vmovdqu64 {mem} {zmmr} - SIMD comparison
vpcmpnled {zmmr} {zmmr} - Compress mask store
vpcompressd {zmmr} {mem} {mask}
Experience says that 1 and 2 should not be the problem (I will eat thumb tacks
if they are). So, I could investigate vpcompressd register to memory directly.
BUT, (IMO) it is much more fun and illuminating to systematically drill-down using the generally applicable top-down approach that also gives us a brief tour of CPU microarchitecture. If that sounds interesting to you, keep reading, otherwise skip to the end. This exact approach is outlined in the paper “A Top-Down Method for Performance Analysis and Counters Architecture” 2 and has been written about by other bloggers as well 3.
Performance
counters (a.k.a performance monitoring counters (PMCs)) can take us a long way after it is determined
where a bottlneck lies. We will not even reach for a profiler and just use
perf list and perf stat. Making sense of the information that a PMC system can provide us demands
at least a high-level understanding of CPU microarchitecture4, and having some numbers for your specific microarchitecture on the back of your hand.
If you already understand the terms frontend, backend, uops, branch prediction, instruction decoding, op cache etc, then you can jump straight to the drill-down.
A Crash Course on CPU Microarchitecture and PMCs
This is going to be very brief as far as expositions on this topic go. There is better exposition out there, both approachable 4 and dense 5. This section simply gets you up to speed with what you need for grokking the top-down analysis approach using PMCs.
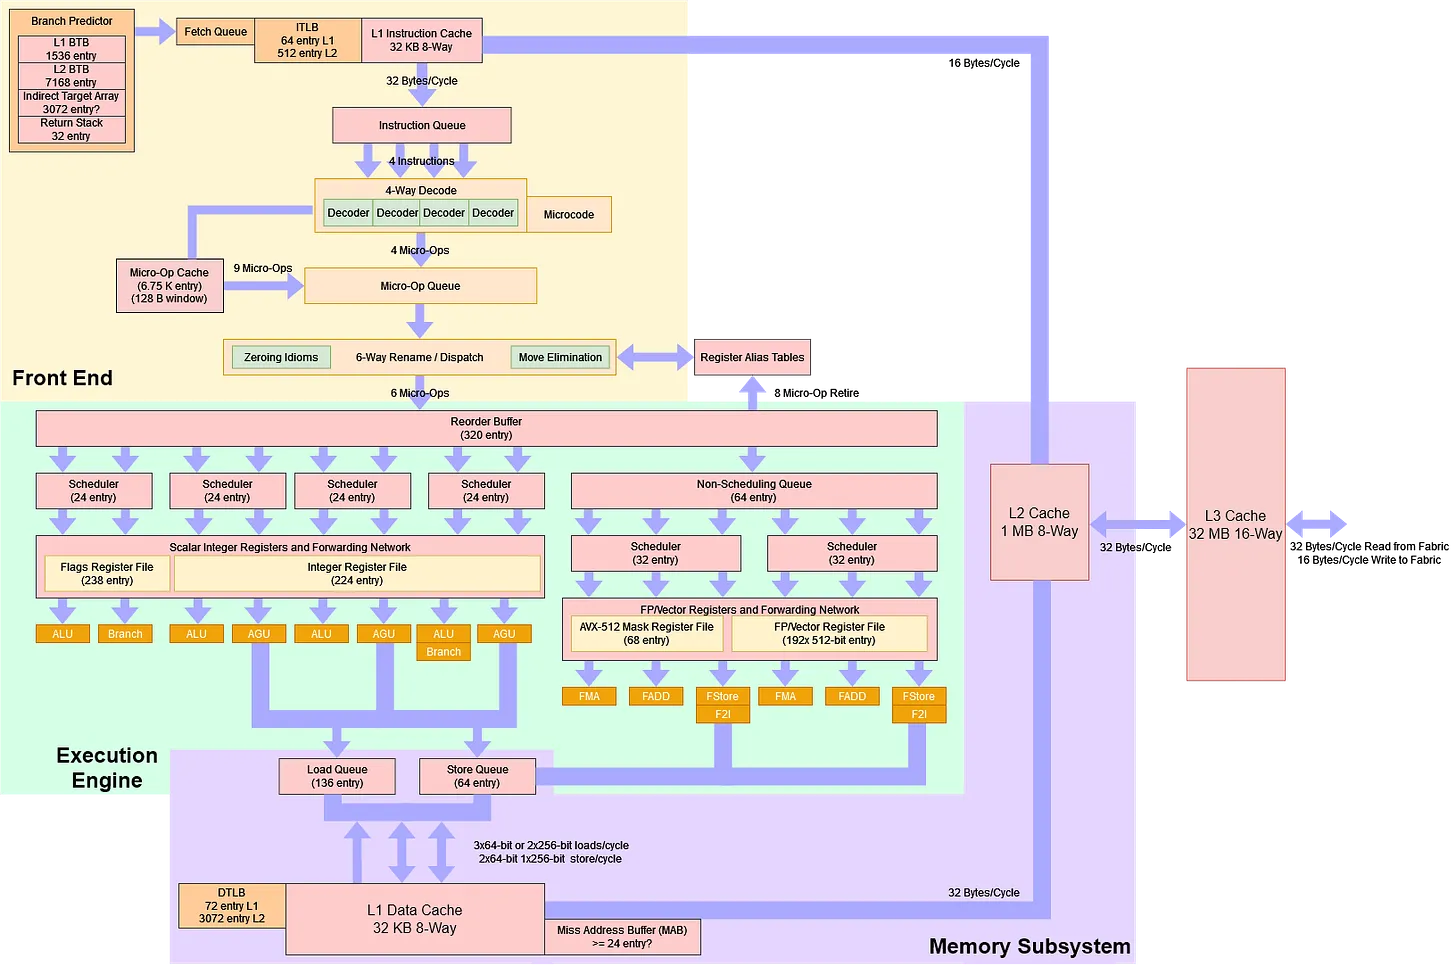
Figure 4 is a high-level block diagram for a typical Zen 4 CPU that shows the two main parts of a CPU: the frontend (FE) and the backend (BE). The FE is responsible for fetching instructions from memory and decoding them into micro-operations (uops) and hand those over to the backend. The backend is responsible for scheduling, executing, and retiring these uops while ensuring that the program semantics do not change, i.e. only certain re-orderings between instructions are permissible.
Decoded uops are stored in the balls a uop queue, which is fed by the decoder
and the uop cache 6. The backend receives uops from
the uop queue whenever it has resources available to begin executing an
instruction.
A piece of code is said to be frontend bound if during a good majority of cycles the backend is ready to receive uops, but the FE has placed any uops in the uop queue. Typical causes of FE boundedness include high iTLB and L1i-cache miss rates, high uop cache miss rates etc.
Similarly, a piece of code is backend bound if the FE has made uops available in the uop queue, but the backend is not ready to receive and begin scheduling. This can happen due to e.g. L1d cache and dTLB misses (read stalls), bad instruction mix resulting in structural and data hazards (e.g. heavy use of dividers, which are typically small in number and unpipelined) etc.
While branch prediction is part of the FE, bad speculation requires its own classification for reasons that will be discussed later.
Ideally, 100% of cycles would fall under the final category - retiring. This reflects pipeline slots utilized by good uops - issued uops that eventually get retired. Hitting 100% retired corresponds to hitting the maximal uops retired per cycle for a given microarchitecture. But, a high retiring fraction DOES NOT necessarily mean no room for more performance. Microcode7 sequences can hurt performance and should be isolated separately.
The Top-Down Analysis using Performance Counters
This method, along with a performance monitoring unit (PMU) architecture recommendation, is described in Yasin’s paper 2. The main idea is to start by categorizing CPU execution time at a high level first. This flags (reports a high fraction value) specific domains (FE bound, BE bound, bad speculation, and retiring) that should then be investigated further while ignoring other domains. Recurse.
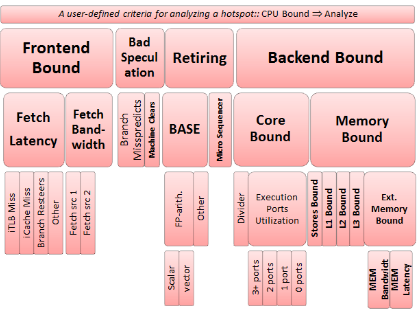
Figure 5 shows the top-down hierarchy of hardware event groups. We start at the top, flag one of the three domains bad domains (frontend, backend, bad speculation), and recurse into the flagged one(s) while ignoring the rest. An inner node should be considered if and only if all its ancestors have been flagged. Fraction values of non-sibling nodes are not comparable.
Note that at level 1, bad speculation must be ruled out first, because oftentimes the values of counters are updated during speculative execution, but they are not reverted if it turned out to be a misspeculation. Let’s just dive right in and see what this looks like.
Level 1
Yasin also proposes a performance counter architecture that is
designed in a top-down manner in order to facilitate diagnosis of realistic
bottlenecks. And would you look at that, Zen 4
already has the nececessary hardware events and groups corresponding level 1 of the
hierarchy (Figure 5) groups defined for us. From perf list:
...
PipelineL1:
  backend_bound
       [Fraction of dispatch slots that remained unused because of backend stalls]
  bad_speculation
       [Fraction of dispatched ops that did not retire]
  frontend_bound
       [Fraction of dispatch slots that remained unused because the frontend did not
        supply enough instructions/ops]
  retiring
       [Fraction of dispatch slots used by ops that retired]
  smt_contention
       [Fraction of dispatch slots that remained unused because the other thread was
        selected]
...
smt_contention can be excluded because I disabled it for the core to which I pin my benchmark thread.
Let’s look at the level 1 results for a 16MB input.
sudo perf stat -M backend_bound,bad_speculation,frontend_bound,retiring -- chrt -f 50 taskset -c 0 ./build/benchmarks/ckl_algorithm_bench --benchmark_filter='BM_CopyIf_Ckl/16777216' --benchmark_min_time=3s
2026-05-11T22:33:04+02:00
Running ./build/benchmarks/ckl_algorithm_bench
Run on (15 X 4966.64 MHz CPU s)
CPU Caches:
  L1 Data 32 KiB (x15)
  L1 Instruction 32 KiB (x15)
  L2 Unified 1024 KiB (x15)
  L3 Unified 16384 KiB (x1)
Load Average: 0.21, 0.48, 0.50
***WARNING*** CPU scaling is enabled, the benchmark real time measurements may be noisy and will incur extra overhead.
---------------------------------------------------------------------------------
Benchmark                       Time             CPU   Iterations UserCounters...
---------------------------------------------------------------------------------
BM_CopyIf_Ckl/16777216   16692437 ns     16500477 ns          254 bytes_per_second=3.78777Gi/s items_per_second=1.01677G/s

 Performance counter stats for 'chrt -f 50 taskset -c 0 ./build/benchmarks/ckl_algorithm_bench --benchmark_filter=BM_CopyIf_Ckl/16777216 --benchmark_min_time=3s':

    62,366,721,033      de_src_op_disp.all               #      0.0 %  bad_speculation          (66.67%)
    30,857,165,236      ls_not_halted_cyc                                                       (66.67%)
    62,341,441,785      ex_ret_ops                       #     33.7 %  retiring                 (66.67%)
   120,535,278,946      de_no_dispatch_per_slot.no_ops_from_frontend #     65.1 %  frontend_bound           (66.67%)
    30,882,682,226      ls_not_halted_cyc                                                       (66.67%)
     2,266,091,111      de_no_dispatch_per_slot.backend_stalls #      1.2 %  backend_bound            (66.67%)
    30,840,562,367      ls_not_halted_cyc                                                       (66.67%)

       6.306886961 seconds time elapsed

       6.213639000 seconds user
       0.021762000 seconds sys
Here it is plotted as a stacked column chart of ratios for 4 problem sizes.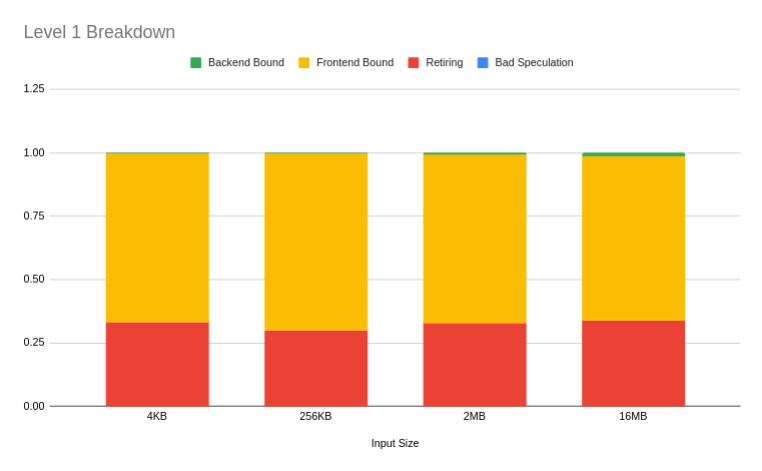
When these event groups are selected, perf automatically calculates the fractions that we are looking for. Let’s find out if the fractions make sense. What events do the individual counters represent?
ex_ret_ops- retiring macro opsde_src_op_disp.all- Ops dispatched from any source- We can see that ops dispatched from all sources is almost equal to the number of retiring ops. Hence the 0.0% bad speculation. Good that we can rule this out immediately and the other counter numbers are already reliable.
ls_not_halted_cyc- Core cycles not in haltde_no_dispatch_per_slot.no_ops_from_frontend- In each cycle counts dispatch slots left empty because the front-end did not supply ops. - I.e. cycles that are frontend bound. Very convenient, innit?de_no_dispatch_per_slot.backend_stalls- In each cycle counts ops unable to dispatch because of back-end stalls. - Also very convenient
So this kernel for a 16M input size has
- 0.0% bad speculation
- 1.2% backend bound cycles
- 65.1% frontend bound cycles
- 33.7% retiring cycles
Note that (0.0 + 1.2 + 65.1 + 33.7)% = 100.0%. Each level in the hierarchy partitions the pipeline into different event classes. So, our kernel is very frontend bound for some reason. Figure 5 tells us we can now safely ignore backend boundedness and start investigating whether the kernel is frontend bandwidth bound or frontend latency bound. We also need to look check if any retiring uops come from the microcode sequencer.
Level 2
Would you look at that, level 2 of the hierarchy has also been neatly organized for us into a group. Yay!
$ perf list
...
PipelineL2
  backend_bound_cpu
       [Fraction of dispatch slots that remained unused because of stalls not
        related to the memory subsystem]
  backend_bound_memory
       [Fraction of dispatch slots that remained unused because of stalls due
        to the memory subsystem]
  bad_speculation_mispredicts
       [Fraction of dispatched ops that were flushed due to branch mispredicts]
  bad_speculation_pipeline_restarts
       [Fraction of dispatched ops that were flushed due to pipeline restarts
        (resyncs)]
  frontend_bound_bandwidth
       [Fraction of dispatch slots that remained unused because of a bandwidth
        bottleneck in the frontend (such as decode or op cache fetch
        bandwidth)]
  frontend_bound_latency
       [Fraction of dispatch slots that remained unused because of a latency
        bottleneck in the frontend (such as instruction cache or TLB misses)]
  retiring_fastpath
       [Fraction of dispatch slots used by fastpath ops that retired]
  retiring_microcode
       [Fraction of dispatch slots used by microcode ops that retired]
...
Here’s the output of perf stat
sudo perf stat -M backend_bound_memory,backend_bound_cpu,frontend_bound_bandwidth,frontend_bound_latency,retiring_fastpath,retiring_microcode \
	-- chrt -f 50 taskset -c 1 \
	./build/benchmarks/ckl_algorithm_bench \
	--benchmark_filter='BM_CopyIf_Ckl/16777216' \
	--benchmark_min_time=3s
...
---------------------------------------------------------------------------------
Benchmark                       Time             CPU   Iterations UserCounters...
---------------------------------------------------------------------------------
BM_CopyIf_Ckl/16777216   16788004 ns     16616390 ns          253 bytes_per_second=3.76135Gi/s items_per_second=1.00968G/s

 Performance counter stats for 'chrt -f 50 taskset -c 1 ./build/benchmarks/ckl_algorithm_bench --benchmark_filter=BM_CopyIf_Ckl/16777216 --benchmark_min_time=3s':

     8,279,342,938      ex_no_retire.load_not_complete   #      0.8 %  backend_bound_memory
                                                         #      0.4 %  backend_bound_cpu        (33.34%)
     2,193,400,952      de_no_dispatch_per_slot.backend_stalls                                        (33.34%)
    12,580,467,726      ex_no_retire.not_complete                                               (33.34%)
    30,990,815,464      ls_not_halted_cyc                                                       (33.34%)
    54,989,538,537      ex_ret_ucode_ops                 #      3.9 %  retiring_fastpath
                                                         #     29.7 %  retiring_microcode       (33.34%)
    30,905,255,222      ls_not_halted_cyc                                                       (33.34%)
    62,204,599,288      ex_ret_ops                                                              (33.34%)
   120,942,499,051      de_no_dispatch_per_slot.no_ops_from_frontend #     25.0 %  frontend_bound_bandwidth  (33.32%)
    12,443,310,206      cpu/de_no_dispatch_per_slot.no_ops_from_frontend,cmask=0x6/ #     40.3 %  frontend_bound_latency   (33.32%)
    30,880,935,531      ls_not_halted_cyc                                                       (33.32%)

       6.325126529 seconds time elapsed

       6.231692000 seconds user
       0.029639000 seconds sys
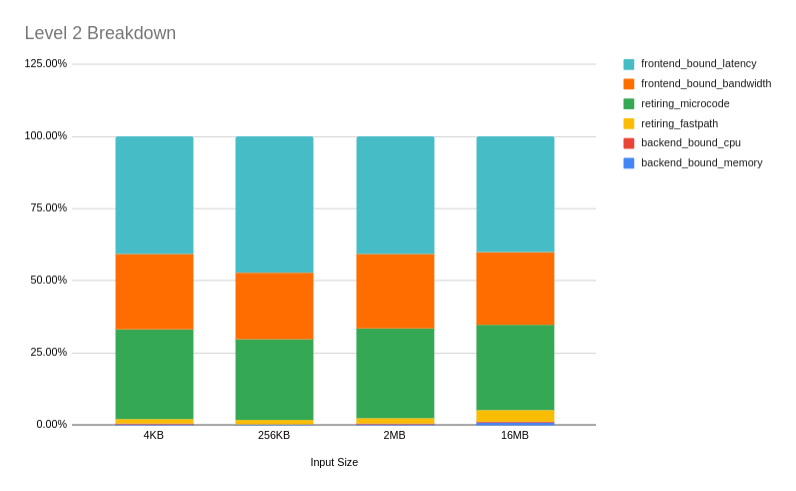
We hebben een serieus probleem.
ex_ret_ucode_ops(retired microcode ops) - Of the 33.8% or so retiring ops, the vast majority are microcode ops.cpu/de_no_dispatch_per_slot.no_ops_from_frontend,cmask=0x6- For 39.8% cycles, 0 upos are being dispatched to the BE, hence the FE latency bound
We have already seen de_no_dispatch_per_slot.no_ops_from_frontend, but what is
the other event that is used to determine FE latency bound cycles?
de_no_dispatch_per_slot.no_ops_from_frontend,cmask=0x6 is the same counter as
de_no_dispatch_per_slot.no_ops_from_frontend but with a counter mask (cmask) of 0x6.
A footnote in the paper 2 explains this.
For example, the FetchBubbles[≥ MIW] notation tells to count cycles in which number of fetch bubbles exceed Machine Issue Width (MIW). This capability is called Counter Mask ever available in x86 PMU [10]
From the Intel 64 and IA-32 Architectures Software Development Manual:
Counter mask (CMASK) field (bits 24 through 31) — When this field is not zero, a logical processor compares this mask to the events count of the detected microarchitectural condition during a single cycle. If the event count is greater than or equal to this mask, the counter is incremented by one. Otherwise the counter is not incremented.
So, this increments the counter when the per-cycle value of
de_no_dispatch_per_slot.no_ops_from_frontend is >= 6. Figure 4 shows that Zen 4 has a 6-wide uop dispatch (the boundary
between FE and BE). Therefore, the event derived using this counter mask counts
the number of cycles where the number of fetch bubbles is equal to the uop
dispatch width, thereby counting stall cycles due to high 2FE latency.
So, at this point we are at
- 25.0 % FE bandwidth bound + 40.2% FE latency bound = 65.2% FE bound
- 1.2% BE bound
- Most of the retiring uops come from microcode.
So, at this point we have narrowed down three things to investigate in the next level of the hierarchy, in decreasing order of priority:
- The microsequencer under the retiring category
- FE frontend bound
- FE latency bound
Retiring Microcode
Based on the level 2 counters, at least one of the instructions is heavily microcoded; it’s almost certainly one of the three AVX-512 instructions.
- SIMD load
vmovdqu64 {mem} {zmmr} - SIMD comparison
vpcmpnled {zmmr} {zmmr} - Compress mask store
vpcompressd {zmmr} {mem} {mask}
As it turns out, this specific pathology is very well-charted territory 8 9. From the the official Zen4 microarchitecture optimization guide:
Avoid the memory destination form of COMPRESS instructions. These forms are implemented using microcode and achieve a lower store bandwidth than their register destination forms which use fastpath macro ops
😬
Measurements using nanoBench show that this instruction can result in a staggering 144 uops (link to table).
uops.info - Table
| Instruction | Lat | TP | Uops | Ports |
|---|---|---|---|---|
| VPCOMPRESSD (M512, K, ZMM) AVX512EVEX | [≤40;≤52] | 9.00 / 72.50 | 144 | 1FP01+1FP12+2FP23+18FP45 |
| VPCOMPRESSD (M512, ZMM) AVX512EVEX | [≤40;≤52] | 9.00 / 72.50 | 144 | 1FP01+1FP12+2FP23+18FP45 |
There are a few ways to verify this ourselves.
- Using the nanobench command provided with the uops.info table
sudo ./kernel-nanoBench.sh -f -unroll 500 -warm_up_count 10 -asm "VPCOMPRESSD zmmword ptr [R14] {K1}, ZMM0" -asm_init "MOV R15, 10000; L: VADDPS ZMM0, ZMM1, ZMM1; VADDPS ZMM0, ZMM1, ZMM1; DEC R15; JNZ L; VZEROALL; VXORPS ZMM0, ZMM0, ZMM0"
- Similar to nanoBench - using llvm-exegesis.
- Profiling the benchmark itself using
perf record.
Profiling with AMD IBS
Using a sampling profiler along with performance counters on a microbenchmark, particularly when we care about per-instruction attribution, can result in inaccuracies like skid, i.e. a sample gets attributed to a nearby instruction instead of the hot instruction actually causing trouble.
AMD introduced hardware for instruction based sampling (IBS)10 in their CPUs. IBS hardware periodically selects an operation based on a preconfigured sampling period. The tagged operation is then monitored as it proceeds through the pipeline, and events triggered by the tagged operation are recorded. On completion of the operation, its event information is reported to the profiler. This results in zero skid by construction, and it does not impose any overhead to instruction execution. Because of its sampling nature, it is mostly useful in hot loops.
As an example, if we directly try to profile ex_ret_ucode_ops, i.e. number of
retired microcode uops using: we get the following from perf annotate
sudo perf record -F 3977 --call-graph fp -e ex_ret_ucode_ops \
	-- chrt -f 50 taskset -c 1 \
	./build/benchmarks/ckl_algorithm_bench \
    --benchmark_filter=BM_CopyIf_Ckl/16777216 --benchmark_min_time=3s
Percent │2b8:   mov         %rbx,%rsi
        │       mov         %r12,%rax
        │       xchg        %ax,%ax
        │2c0:┌─→vmovdqu64   (%rsi),%zmm1
   0.03 │    │  vmovdqu64   0x40(%rsi),%zmm0
   0.15 │    │  sub         $0xffffffffffffff80,%rsi
        │    │  vpcmpnled   %zmm2,%zmm1,%k1
   0.13 │    │  vpcmpnled   %zmm2,%zmm0,%k2
   2.07 │    │  vpcompressd %zmm1,(%rax){%k1}
  48.09 │    │  kmovw       %k1,%ecx
   0.00 │    │  popcnt      %cx,%dx
   0.01 │    │  kmovw       %k2,%ecx
        │    │  mov         %rdx,%rdi
        │    │  and         $0x1f,%edi
        │    │  vpcompressd %zmm0,(%rax,%rdi,4){%k2}
  49.52 │    │  popcnt      %cx,%di
        │    │  add         %rdi,%rdx
        │    │  and         $0x3f,%edx
        │    │  lea         (%rax,%rdx,4),%rax
        │    ├──cmp         %rsi,%r11
        │    └──jne         2c0
i.e. its attributing around 97% of retired microcode uops to a mask register to
general purpose register move (kmovw) and popcnt, which is egregious.
Instead, we sample IBS op events.
sudo perf record -F 3977 --call-graph fp -e ibs_op/cnt_ctl=1/pp \
	-- chrt -f 50 taskset -c 1 \
	./build/benchmarks/ckl_algorithm_bench \
    --benchmark_filter=BM_CopyIf_Ckl/16777216 --benchmark_min_time=3s
Percent │2b8:   mov         %rbx,%rsi
        │       mov         %r12,%rax
        │       xchg        %ax,%ax
   0.33 │2c0:┌─→vmovdqu64   (%rsi),%zmm1
   0.27 │    │  vmovdqu64   0x40(%rsi),%zmm0
   0.31 │    │  sub         $0xffffffffffffff80,%rsi
   0.27 │    │  vpcmpnled   %zmm2,%zmm1,%k1
   0.30 │    │  vpcmpnled   %zmm2,%zmm0,%k2
  47.03 │    │  vpcompressd %zmm1,(%rax){%k1}
   0.24 │    │  kmovw       %k1,%ecx
   0.32 │    │  popcnt      %cx,%dx
   0.32 │    │  kmovw       %k2,%ecx
   0.34 │    │  mov         %rdx,%rdi
   0.37 │    │  and         $0x1f,%edi
  48.17 │    │  vpcompressd %zmm0,(%rax,%rdi,4){%k2}
   0.33 │    │  popcnt      %cx,%di
   0.32 │    │  add         %rdi,%rdx
   0.34 │    │  and         $0x3f,%edx
   0.36 │    │  lea         (%rax,%rdx,4),%rax
   0.36 │    ├──cmp         %rsi,%r11
        │    └──jne         2c0
There we have it, 95.20% retired uops correspond to vpcompressd.
The Fix and Final Moment of Truth
So, there are a few ways to fix this.
In his article8, Daniel Lemire suggests rewriting the single masked store to use the register form of masked compress, followed by a regular SIMD store.
 __m512i compressed = _mm512_maskz_compress_epi8(mask, input);
 _mm512_storeu_si512(output, compressed);
This of course stores additional null bytes since the store is no longer compressed. E.g.
             +-------------------------------+
input      : | 1 | 2 | 3 | 4 | 5 | 6 | 7 | 8 |
             |---+---+---+---+---+---+---+---|
mask       : | 0 | 1 | 0 | 1 | 0 | 0 | 0 | 1 |
             |---+---+---+---+---+---+---+---|
compressed : | 2 | 4 | 8 | 0 | 0 | 0 | 0 | 0 |
             +-------------------------------+
                           ^___^___^___^___^_____ these zeroes also get stored
For copy_if, these will be overwritten by loop iterations writes anyway, but care will have to be taken to allocate extra bytes to destination.
Another suggestion by Mysticial on mersenneforum 9 is the following:
vpcompressd zmm0{k1}{z}, zmm0
kmovd       eax, k1
pext        eax, -1, eax     (the -1 in a register of course)
kmovd       k1, eax
vmovdqu32   [mem]{k1}, zmm0
or
vpcompressd zmm0{k1}{z}, zmm0
vpcompressd zmm1{k1}{z}, [-1]      (constant of all 1s)
vpcmpd      k1, zmm1, [-1], 0      (constant of all 1s), compare for equality
vmovdqu32   [mem]{k1}, zmm0
These use a masked store, so additional space should not be required, and the masked store decodes down to 2 uops on Zen4 (uops.info table link).
Let’s try the maskless store variant.
template <template <typename> class Predicate>
int *copy_if(int const *input, int *output, ssize_t n, const Predicate<int> &p) {
  const auto vp = Predicate<__m512i>();
  constexpr auto vlen = 16;  // (512 / 8) / sizeof(int);
  constexpr auto unroll = 2;
  constexpr auto stride = vlen * unroll;
  auto sn = n - (n % stride);
  int *out = output;
  for (ssize_t i = 0; i < sn; i += stride) {
    const auto v_in1 = _mm512_loadu_epi32(input + i);
    const auto v_in2 = _mm512_loadu_epi32(input + i + vlen);
    const __mmask16 m1 = vp(v_in1);
    const __mmask16 m2 = vp(v_in2);
    const auto v_out1 = _mm512_maskz_compress_epi32(m1, v_in1);
    const auto v_out2 = _mm512_maskz_compress_epi32(m2, v_in2);
    _mm512_storeu_epi32(out, v_out1);
    out += _mm_popcnt_u32(m1);
    // writes some garbage bytes unfortunately
    _mm512_storeu_epi32(out, v_out2);
    out += _mm_popcnt_u32(m2);
  }

  for (auto i = std::max(sn, 0l); i < n; i++) {
    if (p(input[i])) {
      *out = input[i];
      out++;
    }
  }
  return out;
}
Where do we stand now?
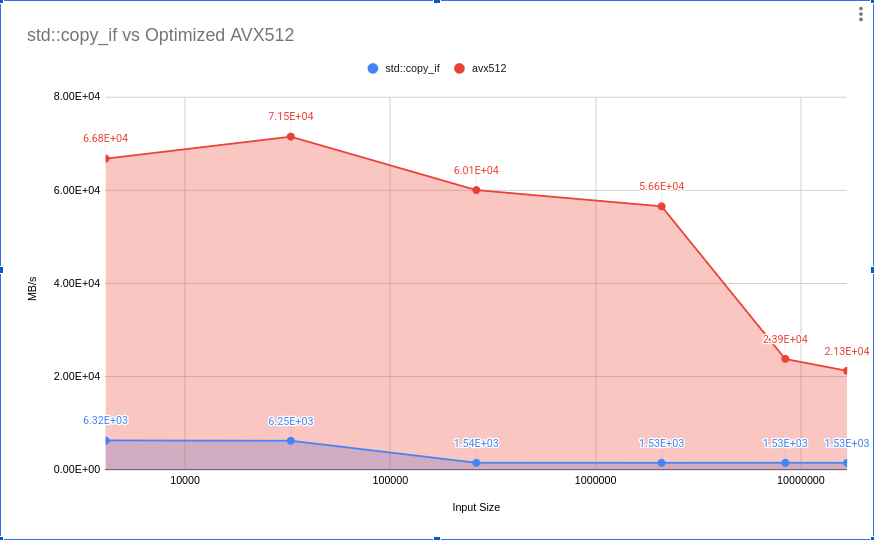
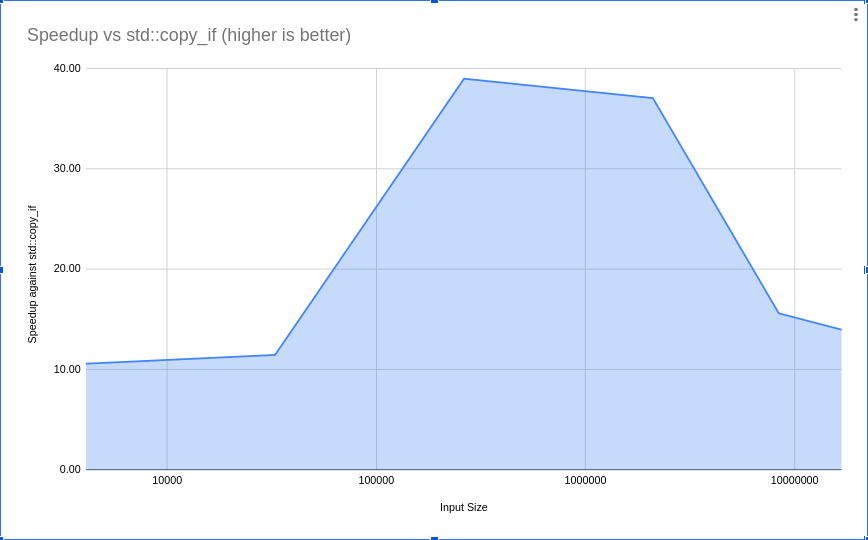
Much better, Figure 9 shows that we finally have
substantial speedups ranging from ~10x to ~40x. over std::copy_if
What’s Left
Of course this implementation is still very crude - lots of parameters are hardcoded:
- Loop unrooll count
- SIMD width
- Element type
- Implementation of compressed store
- The overall implementation of
copy_ifin general
There are multiple ways of implementing a SIMD version of copy_if,
specifically the last part of the loop, i.e. a compress_store. We looked at
two implementations of it. The former is incredibly shit on Zen 4, but it should
hold up just fine on comparable Intel microarchitectures and on Zen 5. Other
implementations, that were mentioned a CppCon talk 11
by one of the co-authors of EVE, include:
- Tiny lookup tables by aqrit on stackoverflow.
- Using BMI2 intrinsics by Peter Cordes, prolific stackoverflow user.
- Switch + shuffle by Z Boson on stackoverflow (thank you aqrit for pointing me towards this).
Some of these will be faster than others depending on the platform, predicate, and the input distribution. Some, including the straightforward AVX512 implementations, will be straight up impossible on some platforms because the requisite instructions might not be available.
There are also several possible ways of providing higher-level hardware agnostic abstractions on top of SIMD intrinsics in order to present a generic interface that exposes such configuration options. C++26 includes such a foundational SIMD library in the form of data-parallel types. C++ compiler release has implemented this.
There are also SIMD library like highway, xsimd, vectorclass, EVE etc, which handle a
lot of these implementations and configurations for you. Here’s a zoo of
eve::algo::copy_if configurations on compiler
explorer.
I am planning to take all these libraries for a spin and analyze their performance and codegen in a series of subsequent blog posts.
Conclusion
When I started this, I expected it to be much simpler. Lots of takeaways from this whole exercise.
- We (finally) managed to get a speedup of up to 40x with the AVX512 intrinsics. There is most likely still room for more tuning.
vpcompressd (M512, K16, ZMM)is very poorly microcoded. In general, check with sources like the uops.info table before committing to a specific intrinsic when writing manual SIMD programs.- If you have determined that your code is CPU-bound, Yasin’s top-down analysis
using
perf statis a great starting point for systematically drilling down into root cause of the bottleneck. - Use IBS on AMD CPUs for high confidence sampling of CPU microbenchmarks to not be thrown off by skid (no pun intended).
- Consider using cross-platform SIMD libraries like EVE, highway, xsimd etc for portable performance.
Most likely I will cover EVE in the next SIMD related article.
Appendix
Benchmark Setup
We would like to reduce variance as much as we can. The canonical reference document for this is the article on reducing variance in the Google Benchmark docs.
Sources of variance
Quoted from the article on reducing variance (emphases mine)
- On multi-core machines not all CPUs/CPU cores/CPU threads run the same speed, so running a benchmark one time and then again may give a different result depending on which CPU it ran on.
- CPU scaling features that run on the CPU, like Intel’s Turbo Boost and AMD Turbo Core and Precision Boost, can temporarily change the CPU frequency even when the using the “performance” governor on Linux.
- Context switching between CPUs, or scheduling competition on the CPU the benchmark is running on.
- Intel Hyperthreading or AMD SMT causing the same issue as above.
- Cache effects caused by code running on other CPUs.
- Non-uniform memory architectures (NUMA).
1 and 6 do not apply to my machine, there are no other NUMA domains and all cores have the same architecture (e.g. no E cores and P cores differentiation).
Disabling SMT
We are benchmarking a potentially memory-bound workload. SMT should be disabled for this. I already have [[https://github.com/RRZE-HPC/likwid/wiki/likwid-topology][likwid-topology]] installed, so I can just use its output to determinte thread siblings.
  --------------------------------------------------------------------------------
  CPU name:	AMD Ryzen 7 255 w/ Radeon 780M Graphics
  CPU type:	AMD K19 (Zen4) architecture
  CPU stepping:	2
  ,********************************************************************************
  Hardware Thread Topology
  ,********************************************************************************
  Sockets:		1
  CPU dies:		1
  Cores per socket:	8
  Threads per core:	2
  --------------------------------------------------------------------------------
  HWThread        Thread        Core        Die        Socket        Available
  0               0             0           0          0             *
  1               0             1           0          0             *
  2               0             2           0          0             *
  3               0             3           0          0             *
  4               0             4           0          0             *
  5               0             5           0          0             *
  6               0             6           0          0             *
  7               0             7           0          0             *
  8               1             0           0          0             *
  9               1             1           0          0             *
  10              1             2           0          0             *
  11              1             3           0          0             *
  12              1             4           0          0             *
  13              1             5           0          0             *
  14              1             6           0          0             *
  15              1             7           0          0             *
  --------------------------------------------------------------------------------
  Socket 0:		( 0 8 1 9 2 10 3 11 4 12 5 13 6 14 7 15 )
  --------------------------------------------------------------------------------
  ,********************************************************************************
  Cache Topology
  ,********************************************************************************
  Level:			1
  Size:			32 kB
  Cache groups:		( 0 8 ) ( 1 9 ) ( 2 10 ) ( 3 11 ) ( 4 12 ) ( 5 13 ) ( 6 14 ) ( 7 15 )
  --------------------------------------------------------------------------------
  Level:			2
  Size:			1 MB
  Cache groups:		( 0 8 ) ( 1 9 ) ( 2 10 ) ( 3 11 ) ( 4 12 ) ( 5 13 ) ( 6 14 ) ( 7 15 )
  --------------------------------------------------------------------------------
  Level:			3
  Size:			16 MB
  Cache groups:		( 0 8 1 9 2 10 3 11 4 12 5 13 6 14 7 15 )
  --------------------------------------------------------------------------------
  ,********************************************************************************
  NUMA Topology
  ,********************************************************************************
  NUMA domains:		1
  --------------------------------------------------------------------------------
  Domain:			0
  Processors:		( 0 8 1 9 2 10 3 11 4 12 5 13 6 14 7 15 )
  Distances:		10
  Free memory:		19259.5 MB
  Total memory:		27831.9 MB
  --------------------------------------------------------------------------------
Alternatively, we can use sysfs to e.g. query the thread siblings of CPU1. Note that.
cat /sys/devices/system/cpu/cpu1/topology/thread_siblings_list
On my system this outputs 1,9. Therefore we need to hot-unplug CPU 9 like so
  sudo echo 0 > /sys/devices/system/cpu/cpu8/online
  # or echo 0 | sudo tee /sys/devices/system/cpu/cpu8/online
See also https://access.redhat.com/solutions/rhel-smt
Setting Thread Affinity
Disable SMT first by the way.
taskset -c 0 ./mybenchmark
But, how do I combine this with perf stat? From man perf-stat
  -C, --cpu=
         Count only on the list of CPUs provided. Multiple CPUs can be provided
         as a comma-separated list with no space: 0,1. Ranges of CPUs are spec‐
         ified with -: 0-2. In per-thread mode, this option is ignored. The  -a
         option  is still necessary to activate system-wide monitoring. Default
         is to count on all CPUs.
and
     --no-affinity
         Don’t change scheduler CPU affinities when iterating over  CPUs.  Dis‐
         ables an optimization aimed at minimizing interprocessor interrupts.
Increasing scheduling priority of the benchmark thread
chrt -f 50 <cmd> sets the scheduling policy to first-in-first-out (FIFO) with
scheduling priority 50. The valid range of priorities is 1-99, and so the
process initiated by <cmd> can be preempted by any other process with a
priority >50. By default perf stat includes in its output the number of
context switches incurred a process’s execution.
Putting it all together
  #---- disable SMT ----#
  cat /sys/devices/system/cpu/cpu1/topology/thread_siblings_list
  # 1,9
  echo 0 | sudo tee /sys/devices/system/cpu/cpu9/online
  #---- CPU frequency scaling ----#
  sudo cpupower --cpu 1 frequency-set --governor performance
  # NOTE: you can also set it to a specific frequency
  #---- Run the benchmark ----#
  sudo perf stat -M backend_bound\
       -- chrt -f 50 taskset -c 1\
       ./build/benchmarks/ckl_algorithm_bench\
       --benchmark_filter='BM_CopyIf_Std/16777216'\
       --benchmark_min_time=3s
llvm-mca
For some reason llvm-mca 22.1.5 predicts an IPC of 3.46, while the achieved IPC was 0.11. Might be worth looking into the scheduling model.
$ llvm-mca
.loop:
vmovdqu64 (%rsi),%zmm1
vmovdqu64 0x40(%rsi),%zmm0
sub    $0xffffffffffffff80,%rsi
vpcmpnled %zmm2,%zmm1,%k1
vpcmpnled %zmm2,%zmm0,%k2
vpcompressd %zmm1,(%rax){%k1}
kmovw  %k1,%ecx
popcnt %cx,%dx
kmovw  %k2,%ecx
mov    %rdx,%rdi
and    $0x1f,%edi
vpcompressd %zmm0,(%rax,%rdi,4){%k2}
popcnt %cx,%di
add    %rdi,%rdx
and    $0x3f,%edx
lea    (%rax,%rdx,4),%rax
cmp    %rsi,%r11
jne    .loop
Iterations:        100
Instructions:      1800
Total Cycles:      520
Total uOps:        2100

Dispatch Width:    6
uOps Per Cycle:    4.04
IPC:               3.46
Block RThroughput: 3.5


Instruction Info:
[1]: #uOps
[2]: Latency
[3]: RThroughput
[4]: MayLoad
[5]: MayStore
[6]: HasSideEffects (U)

[1]    [2]    [3]    [4]    [5]    [6]    Instructions:
 1      8     0.50    *                   vmovdqu64     (%rsi), %zmm1
 1      8     0.50    *                   vmovdqu64     64(%rsi), %zmm0
 1      1     0.25                        subq  $-128, %rsi
 1      1     0.50                        vpcmpnled     %zmm2, %zmm1, %k1
 1      1     0.50                        vpcmpnled     %zmm2, %zmm0, %k2
 2      8     0.50           *            vpcompressd   %zmm1, (%rax) {%k1}
 1      1     0.50                        kmovw %k1, %ecx
 1      1     1.00                        popcntw       %cx, %dx
 1      1     0.50                        kmovw %k2, %ecx
 1      0     0.17                        movq  %rdx, %rdi
 1      1     0.25                        andl  $31, %edi
 2      8     0.50           *            vpcompressd   %zmm0, (%rax,%rdi,4) {%k2}
 1      1     1.00                        popcntw       %cx, %di
 1      1     0.25                        addq  %rdi, %rdx
 1      1     0.25                        andl  $63, %edx
 2      2     0.25                        leaq  (%rax,%rdx,4), %rax
 1      1     0.25                        cmpq  %rsi, %r11
 1      1     0.50                        jne   .loop
Those of you already experienced with AVX-512 on Zen 4 already know where this is going. ↩︎
Yasin, A., 2014, March. A top-down method for performance analysis and counters architecture. In 2014 IEEE International Symposium on Performance Analysis of Systems and Software (ISPASS) (pp. 35-44). IEEE. ↩︎ ↩︎ ↩︎ ↩︎
Denis Bakhvalov: Top-Down performance analysis methodology. ↩︎
See “Modern Microprocessors - A 90 Minute Guide!” for a more elaborate exposition. ↩︎ ↩︎
Consider Appendix C and Chapter 3 of Computer Architecture: A Quantitative Approach 7e for a very serious exposition on CPU backends and branch prediction. ↩︎
Usually there is also a loop buffer, but it’s disabled on Zen 4 as it is mostly a power usage optimization. See AMD Disables Zen 4’s Loop Buffer by Chips and Cheese. ↩︎
Not to be confused with micro-operations (uops), which are the production of custom hardwired decode logic, microcode is a series of simple instructions that replace custom hardware logic executed by a microcode engine. See the Wikipedia article. ↩︎
Daniel Lemire’s blog: AVX-512 gotcha: avoid compressing words to memory with AMD Zen 4 processors ↩︎ ↩︎
Instruction-Based Sampling: A New Performance Analysis Technique for AMD Family 10h Processors ↩︎
Advanced SIMD Algorithms in Pictures - Denis Yaroshevskiy ↩︎